

Honestly, sales have never been more competitive.
Nowadays, sales teams have better tools, more data, and more ways to reach buyers than ever before. Yet hitting revenue targets is getting harder. Buyers are more informed, decision-making groups are larger, and sales cycles continue to stretch.
The teams that win are not just doing more. They are using data to understand what works and where they need to adapt.
That’s why I created this guide.
Along with research from Salesforce, HubSpot, Gartner, LinkedIn, McKinsey, and others, I analyzed Saleshandy’s own platform data, including 74.3M cold emails and 7,699 outbound calls, to uncover what is actually working in sales today.
You’ll find the latest statistics across prospecting, cold email, cold calling, follow-ups, buyer behavior, and outbound sales, along with what these numbers mean for your strategy in 2026.
So, get a cup of coffee. Let’s get into it.
TOC – Sales Statistics
- TL;DR: Sales Statistics That Matter Most for Outbound Teams in 2026
- Sales Prospecting Statistics
- Cold Email Statistics That Matter for Sales Teams
- Sales Follow-Up Statistics
- Cold Calling Statistics
- Sales Funnel and Conversion Statistics
- Sales Statistics by Industry
- Sales Statistics by Regions
- Sales Productivity Statistics
- AI in Sales Statistics
- B2B Sales and Buyer Behavior Statistics
- Sales Referral and Social Selling Statistics
- Sales Closing Statistics
- Cold Calling vs Cold Email vs Social Selling: How Do They Compare?
- How Saleshandy Helps You Turn These Sales Statistics Into Desired Results
- FAQs People Ask Me About Sales Statistics
TL;DR: Sales Statistics That Matter Most for Outbound Teams in 2026
Are you short on time?
No worries, here are the numbers I think every sales and outbound team needs to know for 2026:
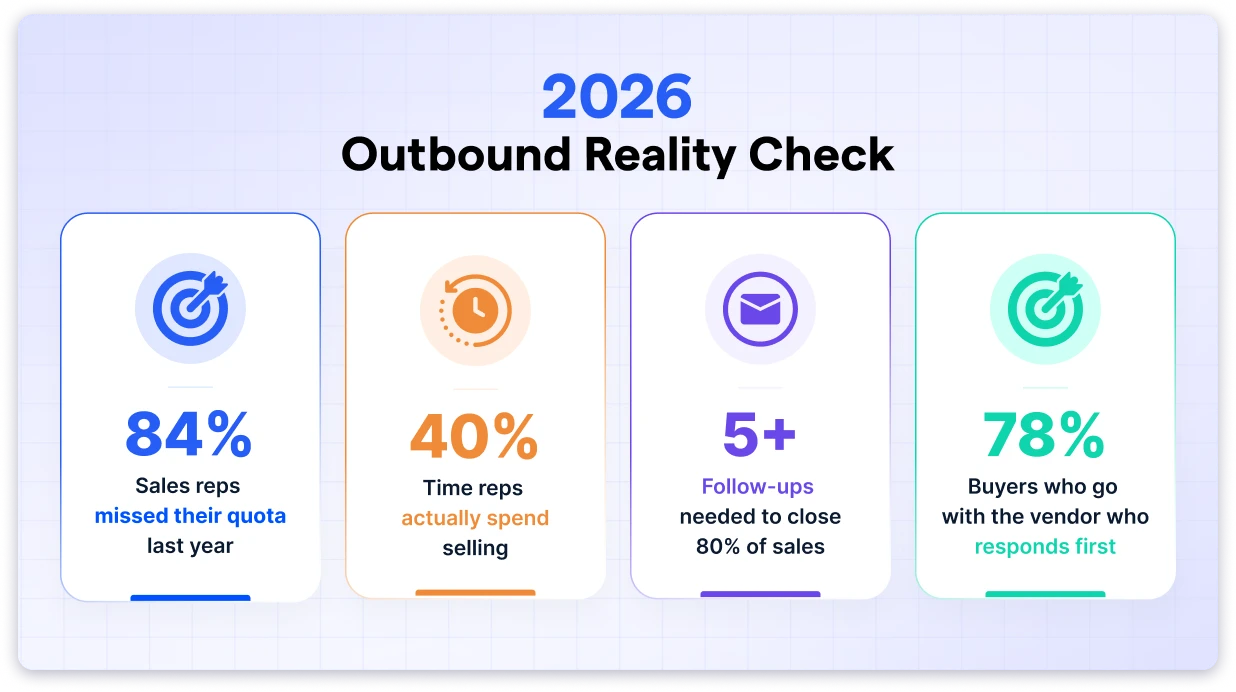
- The quota gap: 84% of reps missed quota last year. That’s not a talent problem. It’s a capacity one. (Salesforce State of Sales 2026)
- Selling time: Reps spend only 40% of their week actually selling. The other 60% goes to admin, meetings, and data entry. (Salesforce)
- Cold email benchmark: Across 74.3M cold emails sent through Saleshandy, the average reply rate is 0.60%. Positive replies come in at 0.10%. (Saleshandy internal data, 2026)
- Cold call benchmark: 44.63% average connect rate across 7,699 outbound calls placed through Saleshandy’s dialer. (Saleshandy dialer data, 2026)
- The follow-up gap: 80% of sales require 5+ follow-ups, yet 44% of reps stop after one attempt. (ZoomInfo)
- Speed to lead: Responding within 5 minutes makes you 9x more likely to engage a lead. And 78% of buyers go with the vendor who responds first. (Drift, GreetNow)
- Multichannel edge: Combining email, phone, and LinkedIn drives 287% higher response rates than email-only outreach. (SkipCall)
- Sales cycle trend: The median B2B sales cycle is now 84 days — a 22% jump since 2022. (Colorlib)
- AI adoption: Reps who partner with AI are 3.7x more likely to hit quota. (Gartner Sales Survey 2024)
Sales Prospecting Statistics
I’ve often noticed that prospecting is where most outbound teams break down.
And it’s not because reps are lazy, but because the math is brutal. The sales statistics below explain why.
How Much Time Do Sales Reps Actually Spend Selling?
Sales reps spend just 40% of their time actively selling, according to Salesforce’s 2026 State of Sales report. And, sadly, the other 60% goes to admin work like data entry, internal meetings, and hunting for the right sales collateral.
Gartner puts the number even higher. It reports that 50% of a rep’s time disappears into non-selling activities across all roles.
For a rep working a standard 40-hour week, that’s fewer than 16 hours actually spent in front of buyers.
And it gets worse when you analyse deeper. Ken Krogue’s widely cited Forbes analysis has consistently pegged actual revenue-generating selling time at just 28% to 35% of a rep’s week across the industry.
So, where the rest of the time actually goes:
- Administrative work (12–15%): Paperwork, internal approvals, and expense reports
- Prospect research and data cleanup (11–14%): Pulling lists, verifying contacts, fixing bad CRM data
- CRM and tech management (5–10%): Updating records, navigating multiple tools, tabbing between spreadsheets
- Internal meetings (10–12%): Cross-functional syncs, pipeline reviews, standups
What Is the Hardest Part of the Sales Process?
Ask any SDR what keeps them up at night, and you’ll get the same answer: prospecting.
Roughly 40% to 42% of salespeople name prospecting as the hardest part of their job, based on data compiled across sales research studies. Closing (35–36%) comes second, and qualifying leads (22%) rounds out the top three. [Drip]
So, the main problem isn’t reaching out. It’s reaching the right person.
As a result, sales teams now rely on multiple data sources to identify potential buyers. In fact, 89.9% of companies now use two or more data tools to research prospects before making contact. [Gartner].
This means reps often spend hours collecting and verifying information before starting a conversation.
The challenge becomes even bigger when you consider modern B2B buying decisions. A single purchase now involves 5 to 16 stakeholders, each with different priorities and decision-making power.
With more people involved and more time spent researching prospects, it is becoming harder for sales reps to maintain consistent pipeline growth.
This is one reason why fewer than half of global sales representatives consistently achieve their quotas.
How Many Touchpoints Does It Take to Book a Meeting?
Reaching a cold prospect takes an average of 8 touchpoints across email, phone, and social. That’s the industry benchmark.
- For B2B outbound specifically, top-performing teams plan for 8 to 12 touchpoints across a 14 to 21-day window before moving on.
- Enterprise and high-ACV deals can push that number to 15+ touches, while smaller or high-intent inbound leads convert much faster.
The problem I often see is that most reps give up after just 2 attempts. That’s well before the point where reply rates actually start to compound. The reps hitting quota aren’t necessarily better closers. They’re just the ones who don’t quit at touch #3.
Saleshandy’s own dialer data shows that it takes an average of 3.51 call attempts to connect with a prospect who eventually answers. Some prospects convert on attempt 1. Others take 20+ tries.
Also, the channel mix matters too.
Combining email, phone, and LinkedIn in the same cadence yields 287% higher response rates than email-only outreach, per SkipCall’s B2B cadence data.
The teams that hit quota are the ones who plan for the attempts, not the ones hoping for a first-touch win.
Sources: Rain Group Sales Prospecting Report, Saleshandy Dialer Data (2026)
How Should SDRs Prioritize Prospecting in 2026?
By now, the challenge is clear: SDRs are spending more time finding prospects than selling to them.
The first step is cutting down research time. Instead of switching between LinkedIn, spreadsheets, and multiple databases, reps need one reliable source to find accurate contacts quickly.
Next comes follow-up. Most prospects do not reply after the first message, so a strong cadence across email, LinkedIn, and calls is key.
Finally, not every prospect deserves the same approach. Reps should prioritize people showing buying signals like opens, clicks, and replies.
Where Saleshandy fits: Saleshandy’s Lead Finder gives teams access to 852M+ verified contacts with 98% data accuracy. Reps can find and verify prospects without juggling multiple tools.
AI Prompt-to-List lets teams create targeted prospect lists using simple instructions, while Waterfall Enrichment checks multiple data sources to give accurate contact information.
Once the list is ready, Saleshandy helps teams run multichannel outreach with email, LinkedIn, and call sequences. The Unified Inbox keeps replies from multiple mailboxes in one place, so reps can focus on conversations.
Cold Email Statistics That Matter for Sales Teams
Cold email is still the most scalable outbound channel. But the numbers people quote are usually inflated. Here’s what the data actually shows.
What Is the Average Cold Email Response Rate in 2026?
Across 74.3M cold emails sent through Saleshandy, the average reply rate sits at 0.60%. Positive replies (actually interested prospects) come in at 0.10%. This means roughly 1 in 6 replies is a warm signal worth following up on.
Open rate averages 11.75% across all recipient email service providers.
Here’s the breakdown by recipient inbox provider:
| Recipient ESP | Emails Sent | Open Rate | Reply Rate | Positive Reply Rate | Bounce Rate |
|---|---|---|---|---|---|
| Google (Gmail/Workspace) | 36.8M | 10.23% | 0.58% | 0.13% | 2.40% |
| Microsoft (Outlook/365) | 16.5M | 10.06% | 0.52% | 0.12% | 2.46% |
| Others (Yahoo, Zoho, etc.) | 21.1M | 15.75% | 0.70% | 0.05% | 1.67% |
Key Takeaway:
- Gmail recipients open less often, but when they reply, they reply with real intent.
- Microsoft-hosted inboxes are the hardest to land in cleanly (highest bounce rate).
- And smaller ESPs give the highest open and reply rates because their spam filters are less aggressive.
Our cold email statistics study puts the average outreach reply rate at around 8.5%, but that includes warm outreach and PR pitches. For true cold sales outreach, the sub-1% range is realistic.
Source: Saleshandy Internal Data (2026)
How Many Emails Should a Cold Email Sequence Have?
Here’s a tension every SDR runs into: send too few emails and you leave replies on the table. Send too many, and you get flagged as spam.
The sweet spot is 4 to 7 total touches (one initial email plus 3 to 6 follow-ups), based on cold email benchmark data from Saleshandy.
But most reps never get there.
Around 70% of salespeople stop after sending just one email. And this is exactly why the reps who do follow up win the majority of the pipeline.
Here’s the math that explains why persistence pays.
Roughly 58% of replies come from the first email. The remaining 42% come from follow-ups.
So if you’re stopping at email #1, you’re deliberately walking away from nearly half of every reply your sequence could ever generate.
See, the floor and ceiling both matter. Fewer than 4 emails, and you’re leaving that 42% on the table. More than 7 to 9 emails, and you hit spam complaints, unsubscribes, and sharp deliverability drops.
Sending the same prospect multiple emails increases response rates by 160%. But only if each email earns its own place in the inbox.
What Makes a Cold Email Subject Line Work?
In Saleshandy’s analysis of 74.3M cold emails, personalized subject lines are 50% more likely to be opened than generic ones. HubSpot’s data backs the exact same finding.
But personalization is just the entry point. Two more patterns show up consistently in the data.
- Question-format subject lines outperform statement-format ones by roughly 21%, with some tests pushing open rates as high as 46%.
- Length is where most people get bad advice. Saleshandy’s data shows longer subject lines (36 to 50 characters) actually get 24.6% higher response rates than short ones.
The highest engagement clustering around 2 to 4 words or 36 to 50 characters.
So the real rule isn’t “keep it short” or “keep it long.” It’s write something that reads naturally, includes a hook worth clicking, and fits mobile.
Speaking of mobile: 40% of emails are opened on mobile first, and mobile inboxes only show the first 4 to 7 words of a subject line. Write your subject line as if those first few words are all your reader will ever see. Because for a lot of them, they are.
Sources: Saleshandy Internal Data (2026)
What Is the Best Time to Send a Cold Email?
The best-performing send windows for cold email cluster around Tuesday, Wednesday, and Thursday, between 9:00 AM and 11:30 AM in the recipient’s local timezone. [Saleshandy Internal Data (2026)]
Other studies show a similar pattern:
| Window | Why it works |
|---|---|
| Tues–Thurs, 9–11:30 AM (primary) | Peak inbox-triage window; highest open + reply rates |
| 1:00–3:00 PM (secondary) | Post-lunch catch-up; solid engagement for mid-level managers |
| Monday mornings | Buried under weekend backlog; avoid |
| Friday afternoons | Nobody replies; energy is already on the weekend |
| Weekends | Dead across almost every industry |
A few nuances sales teams should know:
- C-suite executives check emails earliest (6 to 8 AM) or late in the evening when the office is quiet. Standard business-hour windows miss them.
- Mid-level managers engage most in mid-morning or early afternoon blocks.
- Timezone rule: Always schedule to the recipient’s local timezone, not your own. A perfectly timed email at 9 AM your time is 3 AM theirs.
Sources: Saleshandy Internal Data (2026)
Truth Most Tool-Obsessed Teams Miss:
Send time matters less than send consistency. A sequence that ships reliably at 9 AM local time every Tuesday will outperform one that goes out whenever the rep remembers to hit send.
How to Improve Cold Email Response Rates Based on These Stats
If your cold email reply rate is below 0.60%, the issue is usually not just the copy. It often comes down to three things: data quality, deliverability, and personalization.
- Start with accurate data: A healthy campaign depends on accurate contact data. A 2.20% bounce rate is the average across Saleshandy campaigns. If your bounce rate is much higher, you are likely sending to outdated or invalid addresses, which can hurt your sender reputation.
- Next, focus on deliverability: A great email can’t generate replies if it never reaches the inbox. Warm up new domains for 3 to 4 weeks, and set up SPF, DKIM, and DMARC before increasing your sending volume.
- Finally, improve personalization: Adding a first name is not enough. The best cold emails mention something specific about the prospect, their company, role, or a recent trigger.
Saleshandy includes email warm-up, sender rotation across multiple email accounts, and Inbox Radar to check whether emails are reaching Primary, Promotions, or Spam.
Sequence Score helps catch potential issues before launch, while A-Z testing lets teams test different subject lines and email variations to find what works for their audience.
Sales Follow-Up Statistics
Cold email opens the door for sales, and follow-ups walk through it.
The sales statistics on follow-up behavior are some of the most damning in the entire outbound category.
This is where most deals die and where the biggest wins hide.
How Many Follow-Ups Does It Take to Close a Sale?
Let me answer this straightforwardly: the deals go to whoever doesn’t quit.
80% of successful sales require 5 or more follow-ups, per ZoomInfo, with the full range landing somewhere between 5 and 12 touches depending on how complex the deal is.
Enterprise deals sit at the top of that range. SMB and mid-market land closer to 5 to 7.
But almost nobody actually gets there.
Only 2% of sales close on the very first touch. But 44% of reps give up after one follow-up. And by attempt #5, 92% of reps have quit.
That means the small handful of reps who keep going are competing for 80% of the pipeline with almost nobody else in the ring.
Here’s the part that should sting a little.
82% of buyers say they’re open to taking meetings with salespeople who persist with their outreach. So the buyers want the follow-ups. It’s the reps who are convinced (wrongly) that persistence is annoying.
And even a single follow-up email can lift reply rates by up to 65.8%. That’s one email, just one. So, don’t stop.
How Fast Should You Follow Up With a Lead?
Once a lead fills out your form, you have exactly one window to win them: the first five minutes.
Responding within 5 minutes makes you 9x more likely to engage a lead compared to waiting, per the Lead Response Management study.
Some newer benchmarks push that number even higher, with reports of up to 21x more likely to qualify the lead when you catch them inside the 5-minute window.
After 5 minutes, engagement odds drop by roughly 400%. After an hour, they’re near zero.
And here’s the closer: 78% of buyers go with the company that responds first. Not with the best pitch, or the lowest price.
But almost nobody actually responds fast.
- Only 7% of companies hit inbound leads within 5 minutes.
- 50% take 5 business days or more.
The industry average response time is 47 hours, and more than half of web leads are never contacted at all.
Fact You Need to Know: Half of the leads your marketing team worked hard to generate never get a single sales touch.
Sources: Drift Lead Response Survey, GreetNow Lead Response Data
Does Persistence in Sales Follow-Up Actually Pay Off?
Without a doubt, YES.
35% to 50% of sales go to the vendor that responds first, per InsideSales research.
But speed is only half the story. Persistence is the other half.
60% of customers say no four times before they say yes. But only 12% of reps are willing to keep asking after the fourth no.
The fifth ask can bring the “yes” after four “nos.” And 88% of the reps who could have earned it have already walked away.
That gap between what buyers need and what reps deliver is where quota goes to die.
Follow-Up Gap Across the Average Sales Team:
| Behavior | % of Reps | Outcome |
|---|---|---|
| Never follow up | 48% | Miss up to 80% of potential sales |
| Stop after 1 attempt | 44% | Lose to competitors who persist |
| Follow up 5+ times | ~8% | Capture the majority of closed deals |
The teams closing deals aren’t necessarily better at cold outreach. They’re better at not giving up. I know it sounds a bit filmy, but it’s the truth.
Source: InsideSales / XANT Lead Response Research
Why Do Most Sales Follow-Up Sequences Fail?
I’ve seen most follow-up sequences fail for three simple reasons.
- First, follow-ups themselves get missed. When reps have to manually remember the 4th touch on day 9 across dozens of prospects, some leads will always slip through.
- Second, the emails stop adding value. A follow-up that only says “just checking in” does not give prospects a reason to reply. Each touch should bring a new insight, resource, or reason to start a conversation.
- Third, replies get buried. When responses are spread across multiple inboxes, sales teams can miss interested prospects.
But there is a solution to avoid these pitfalls and strengthen your follow-ups.
Saleshandy’s Automated Sequences trigger every follow-up email, LinkedIn step, and dialer prompt on schedule so nothing gets skipped.
Spintax and Conditional Sequences let you vary follow-up copy at scale without manually editing each email.
Unified Inbox pulls replies from every connected mailbox into one view, and AI Reply Categorization automatically tags replies as Interested, Not Interested, Out of Office, or Bounce, so reps only see the ones worth acting on.
Cold Calling Statistics
Before we jump in, let me clarify one thing first: Cold calling isn’t dead in 2026.
But the sales statistics on connect rates and voicemail volume demand persistence and better tooling than most teams currently have.
Is Cold Calling Still Effective in 2026?
Yes, indeed.
- 69% of B2B buyers accepted a cold call from a new provider in the past year.
- 82% of buyers say they’re willing to meet with a seller who reaches out proactively.
And 57% of C-suite executives actually prefer phone outreach over any other channel.
Yet only 37% of reps report closing most of their deals via cold calls.
Over 50% of B2B leads still originate from cold outreach. But the game has changed. “Smile and dial” through 200 random numbers is dead.
What works in 2026 is cold calling built on verified data, local presence numbers, and a real multichannel cadence wrapped around each dial.
The reps who treat cold calling as one channel inside a bigger outbound engine still win. The reps who treat it as a numbers game with no strategy don’t.
Source: Saleshandy Dialer Data (2026)
What Is the Average Cold Call Success Rate?
Brace yourself, because the number is smaller than most reps want to hear.
The average cold call success rate (dial to meeting booked) is 2% to 3%. Only 3% to 10% of dials even reach a live human. The rest hit voicemail, a gatekeeper, or a busy signal.
But top performers pull that number up dramatically. Elite SDR teams hit 6% to 11%+ success rates by working verified data, precise targeting, and disciplined cadences instead of random lists.
Across 7,699 outbound calls placed through Saleshandy’s dialer since April 2026, the average connect rate is 44.63%.
And a small detail most people miss: a successful cold call averages just 93 seconds. Conversational quality beats brute volume every time.
Source: Saleshandy Dialer Data (2026)
How Many Cold Calls Does It Take to Reach a Prospect?
Saleshandy’s dialer data shows an average of 3.51 attempts per prospect before a successful connection, with a median of 2. The lower number reflects users working warmer, better-researched lists, not colder lists.
However, it takes an average of 8 attempts to reach a cold prospect.
One More Number Worth Knowing:
80% of calls go to voicemail, and reps spend roughly 15% of their calling time just leaving them. That’s why voicemail drop (record once, drop with one click) is now standard in every serious dialer.
Sources: Saleshandy Dialer Data (2026)
What Cold Call Techniques Actually Work?
Gong’s conversation intelligence data (from millions of analyzed calls) shows a few patterns that separate top performers from average reps:
- Opening with “How have you been?” increases meeting-booking rate by 660% compared to “Did I catch you at a bad time?”
- Successful cold callers talk for ~54% of the call. Underperformers talk for only ~42%.
- Using collaborative language (“we,” “our,” “us”) instead of possessive language (“I,” “my”) lifts success rates by 35 to 55%.
Saleshandy’s dialer data shows the strongest connect rates land on Tuesday (46.4%), with Sunday at the bottom (34.9%).
The best hour window is 3 to 6 PM US Eastern, peaking at 53.7% around 5 to 6 PM. This matches every classic study on cold call timing.
Source: Saleshandy Dialer Data (2026)
How Can Sales Teams Improve Cold Call Success Rates?
Honestly, that old advice (“smile and dial”) doesn’t hold anymore.
Here’s what does:
- Call the right hours: 3 to 6 PM local time consistently outperforms mornings. Tuesday and Wednesday outperform Monday and Friday.
- Use local presence dialing: Local area codes get answered more often than out-of-state numbers. Even in an era of number spoofing, familiar area codes still lift pickup rates.
- Log calls without leaving the dialer: If your reps have to switch tools to log every call, they’ll skip it, and you’ll lose the data you need for coaching.
Saleshandy’s built-in dialer includes local presence dialing, number rotation across multiple lines, voicemail drop (record once, drop with one click), and AI call summaries so reps stop taking notes mid-call.
Every call, transcript, and summary logs automatically against the prospect record, no manual entry required.
For teams running email + calls + LinkedIn together (which is 100% of Saleshandy dialer users, based on platform data), the dialer sits inside the same sequence workflow, not as a separate tool.
Sales Funnel and Conversion Statistics
I’ve seen that almost everyone watches the top of the funnel.
How many leads came in? How many prospects are we reaching? Is the pipeline full enough?
But the problem is that most deals don’t die at the top. Actually, they disappear somewhere in the middle.
How?
Here’s what the funnel and conversion data actually shows about where sales are won and lost in 2026.
What Is the Average Sales Conversion Rate?
I’ve seen a lot of teams get confused. “Sales conversion rate” means two very different things depending on which end of the funnel you’re looking at.
If you mean visitor-to-customer (the whole funnel), the average sits between 2% and 5% across most industries, per Ruler Analytics. That’s how marketing usually reports it.
If you mean opportunity-to-closed-won (the sales team’s number), it climbs to 20% on average, with software at ~22% and biotech closer to 15%.
Both numbers are right. They’re just measuring different points.
Here’s what the B2B funnel looks like stage by stage:
| Stage | Conversion Rate |
|---|---|
| Visitor → Lead | 2% to 5% |
| Lead → MQL | 20% to 25% |
| MQL → SQL | 12% to 25% |
| SQL → Closed-Won | 6% to 9% |
Two things move these numbers the most.
Sales enablement: Teams with a formal enablement program hit a 49% win rate on forecasted deals, versus 42.5% for teams without.
Lead source: Inbound leads from organic search convert 3 to 5x higher than paid ads. Referrals convert higher than either. If your top-of-funnel is 100% paid, your conversion math is fighting gravity.
Sources: Ruler Analytics Conversion by Industry, Apollo Sales Conversion Rate, HubSpot Sales Data
Where Do Deals Die in the Funnel?
Ask a sales leader where they lose the most deals, and they’ll usually blame the last step: budget, procurement, or a competitor swooping in at the finish line.
But the data tells a different story.
The biggest volume of drop-offs happens at the very top. B2B funnels lose 98.6% of visitors before they ever become a lead. And of the leads that do come through, only 25% are high enough quality for sales to work directly (Gleanster Research).
Then the middle quietly kills what survives.
Only 13% to 15% of MQLs convert into SQLs in a standard B2B pipeline.
That means 85% of qualified leads stall in the handoff, either from slow follow-up or weak qualification.
The bottom of the funnel does its own damage too. Over 30% of reps say budget is the top deal-killer, followed by timing (25.5%), decision-making friction (18%), and value gaps (12%).
And with 6 to 10 decision-makers now involved in the average B2B deal, procurement reviews, security checks, and legal redlines quietly kill deals that felt 90% closed.
The Pattern I Noticed:
Deals rarely die in one dramatic moment. They die by attrition, stage by stage, while nobody’s watching the middle.
Sources: Neil Patel Funnel Drop-Off Data, SalesHive B2B Funnel Research, Sales Insights Lab, Gleanster Research
How Long Is the Average Sales Cycle in 2026?
The median B2B sales cycle now sits at 84 days, per Colorlib’s 2026 benchmark data.
That’s actually a 22% jump since 2022. And 57% of sales professionals say cycles feel longer than they did a year ago, per Salesforce State of Sales 2026.
But the “average” hides a huge range depending on deal size.
| Deal Size | Typical Cycle Length |
|---|---|
| SMB (under $15K) | 14 to 30 days |
| Mid-Market ($15K–$50K) | 30 to 60 days |
| Enterprise ($100K+) | 90 to 365+ days |
Deal size isn’t even the biggest driver. It accounts for only 27% of the variance in cycle length. The rest comes from stakeholder count (mid-to-large deals now involve a median of 6 to 11 decision-makers) and process complexity.
And here’s the kicker: 67% to 71% of the B2B buying journey is now self-directed before a prospect ever contacts sales. By the time someone lands on your demo request page, they’ve already done most of their evaluation without you.
Sources: Colorlib Sales Cycle Data, Salesforce State of Sales 2026, Digital Applied B2B Marketing Statistics
What Is Causing the Longest B2B Sales Cycles in 2026?
Three forces are stretching cycles:
- Bigger buying committees: The average B2B deal now involves 22 stakeholders, per LinkedIn’s 2025 B2Believe research, up from 7 to 10 just a few years ago. Every additional stakeholder adds review cycles.
- Higher scrutiny on spend: Budget approvals that used to require one signature now require three. Finance and procurement are involved earlier.
- AI-driven buyer research: Buyers self-educate through AI chat, review sites, and communities before ever speaking to a rep. 67% of the B2B journey happens digitally before contact, per Worldwide Business Research.
Sales Statistics by Industry
Different industries convert at very different rates.
Sales statistics for enterprise software look nothing like the numbers for retail or biotech.
Here’s the benchmark by sector:
| Industry | Average Close Rate | Average Sales Cycle |
|---|---|---|
| Software / SaaS | ~22% | 84 days |
| Financial Services | ~19% | 90+ days |
| Manufacturing | ~27% | 90+ days |
| Biotech / Healthcare | ~15% | 120+ days |
| Business Services | ~27% | 45–60 days |
| Retail | ~29% | Short (7–30 days) |
| Media / Marketing | ~23% | 30–60 days |
Sales cycles for enterprise deals (>$100K ACV) run 2 to 3x longer than SMB deals across every industry.
Source: HubSpot Industry Close Rate Data
Sales Statistics by Regions
Sales statistics vary heavily by region. If you’re running outbound across geographies, these benchmarks matter:
- North America: Highest average deal sizes in B2B SaaS, but also the most competitive inbox environment. Cold email reply rates typically 20 to 30% lower than in emerging markets.
- Europe: Longer sales cycles (regulatory review, GDPR-driven procurement) but higher retention rates once closed.
- Asia-Pacific: Faster cycles for SMB, longer for enterprise. LinkedIn is dominant for B2B outreach in India and Southeast Asia; email dominates in Japan and Korea.
- LATAM and MENA: Underserved markets with high response rates but lower average deal sizes. Cold email response rates run 2 to 3x higher than in North America.
75% of European sales teams and 74% of North American teams say virtual meetings deliver the same customer satisfaction as in-person meetings for standard accounts, per McKinsey.
Source: McKinsey Future of B2B Sales
Sales Productivity Statistics
Here’s the uncomfortable truth: most reps aren’t underperforming because they’re bad at selling.
They’re underperforming because they barely get to sell.
Here’s what the data says about where the hours actually go, and what’s keeping quota out of reach.
Why Are Sales Reps Not Hitting Quota?
84% of sales reps missed quota last year, per Salesforce State of Sales 2026. And before you blame it on a talent problem. Let me tell it’s not. It’s a capacity problem.
I’ve seen these three forces quietly stacking against every rep.
- Unrealistic targets: Quotas rose 37% in recent cycles while markets grew by less than 10%. Leadership is setting targets based on desired revenue, not on what a rep can realistically deliver in the current buying environment.
- Reps have no time to sell: They spend 60% of their week on non-selling work and juggle 10+ disconnected tools. 42% of sellers say they’re overwhelmed by their tech stack alone.
- Deals take longer than the quota cycle assumes: Average B2B deals close 23% slower than they did two years ago, driven by bigger buying committees and stricter budget scrutiny. The quota is annual. The deals are not.
As a result, overwhelmed reps are 45% less likely to hit quota, per Gartner. And when 84% of the team is overwhelmed, the miss isn’t a coincidence. It’s the system working as designed.
Sources: Salesforce State of Sales 2026, Gartner Sales Survey 2024, SPOTIO Sales Quota Gap Research
How Many Tools Do Sales Teams Use?
The average sales team uses 8 tools to close a single deal, per Salesforce. Broader benchmarks push that number to 10 to 15 tools across the full tech stack.
And reps are drowning in it.
- 66% of sales reps say they feel overwhelmed by the sheer number of apps they’re expected to use.
- Tool sprawl and constant context-switching waste up to 27% of potential selling time.
- Every switch between tools costs a rep roughly 15 to 20 minutes of ramp-up before productive work resumes.
The solution doesn’t lie in fewer tools. It’s fewer platforms.
Top-performing teams use nearly 3x more sales technology than underperformers, but they consolidate that tech onto 4 to 6 core platforms instead of 10+.
That’s why 84% of sales teams without an all-in-one platform plan to consolidate their tech stack in the next year.
More capability. Fewer logins. That’s the direction the entire industry is moving.
Sources: Salesforce State of Sales 2026, SyncGTM Sales Tech Stack Research
What Kills Sales Productivity?
After spending a decade helping B2B teams book more meetings, here are the biggest productivity leaks I see in most outbound teams:
- Manual data entry: 10 to 15% of a rep’s week logging calls, emails, and outcomes into a CRM.
- Content search: 84% of sales executives identify finding the right sales collateral as the #1 productivity gap.
- Tool switching: 5+ tabs open, and every switch resets focus.
- Bad data: Reps spend 20 to 40% of their week researching prospects, often re-doing work another rep already did.
Source: “Learn to Win Sales Productivity” Research
How to Fix Sales Productivity When Reps Spend 60% on Admin
Here’s what I suggest you do to increase your productivity by 3×:
You don’t fix a 60% admin problem with better time management. You fix it with better systems.
- Automate logging: Every call, email, and prospect update should log automatically. If your rep has to type it in, they’ll skip it.
- Unify the stack: Reduce your outbound tool count from 8 to 3. Prospecting, sequence execution, and reply management should live in one place.
- Automate the follow-up cadence: Sequences, not sticky notes.
For this, Saleshandy consolidates Lead Finder (prospecting), sequences (email + calls + LinkedIn), Unified Inbox (reply management), and dialer (calling) into a single platform.
No per-seat pricing, so scaling doesn’t inflate the tool bill.
Every call, email, and reply logs automatically against the prospect record, so reps don’t lose 90 minutes a day to manual data entry.
AI in Sales Statistics
It’s 2026. The reps closing quota next quarter aren’t the ones with the sharpest pitch.
They’re the ones who have quietly handed off their busywork to AI so they can spend more time actually selling.
Here’s what the data says about where sales teams stand on AI adoption in 2026, what they’re using it for, and how top performers are pulling ahead.
How Many Sales Teams Are Using AI in 2026?
AI in sales isn’t the future anymore. It’s the baseline.
94% of sales leaders with AI agents say those agents are essential for meeting business demands, per Salesforce State of Sales 2026. And roughly 70% of top-performing sales teams now integrate AI into their daily workflows.
The teams sitting it out aren’t just falling behind. They’re losing on quota, productivity, and pipeline math all at once.
Sellers who partner with AI are 3.7x more likely to hit quota, per Gartner. 84% of salespeople already using AI say it has improved their customer interactions. And an overwhelming 86% of AI-using sales teams report positive ROI within the first year.
The money is following the same story. The global AI-in-sales market is projected to grow from $24.6B in 2024 to $145B by 2033, with sales and marketing now commanding over half of all corporate AI automation budgets.
Sources: Salesforce, Gartner Sales Survey 2024, Sopro AI Sales Statistics
What Does AI Actually Do for Sales Teams?
Sales professionals using AI save an average of 2 hours and 15 minutes per day on admin work, per Sopro’s 2026 research. That’s roughly 5 hours a week clawed back from data entry and busywork.
Teams that automate spend 37% more time directly with customers and 61% less time on manual data entry. Organizations implementing sales AI report up to a 40% jump in overall sales productivity.
The top 3 use cases sales teams turn to AI for, per Salesforce’s 2026 data:
- Fulfilling orders and post-sale tracking (automation and follow-through)
- Tracking product usage (expansion signals)
- Creating sales quotes (deal desk automation)
Beyond those: 36% of AI-using sales teams use it for rep coaching. 85% of reps with AI say it frees them to focus on higher-value work. 88% say it directly increases their odds of hitting quota.
And when it comes to conversion, AI-powered lead scoring lifts conversion rates by 27% to 30%, and shortens sales cycles by up to 25%.
The pattern is consistent: AI handles the busywork so reps can spend more time on the human parts of selling.
Sources: Salesforce State of Sales 2026, Sopro AI Sales Statistics
How Are Top-Performing Sales Teams Using AI in 2026?
Top performers use AI for four things, in this order:
- Prospect generation: AI-powered list building (natural language search across large B2B databases) cuts prospecting research from hours to minutes.
- Sequence copywriting: AI drafts the first pass of email copy, then reps edit for voice and specificity.
- Reply categorization: AI tags every reply as Interested, Not Interested, Out of Office, or Question, so reps only touch the replies that need a human response.
- Call summaries: AI transcribes and summarizes every call, then updates the prospect record automatically.
The best part?
Saleshandy’s AI stack covers all four.
- AI Prompt-to-List turns natural language (“SaaS founders in Austin with 10 to 50 employees”) into a filtered contact list.
- AI CoPilot drafts sequences and personalization at scale.
- AI Reply Categorization auto-tags replies inside Unified Inbox.
- AI Call Summaries transcribe and summarize dialer calls without manual note-taking.
B2B Sales and Buyer Behavior Statistics
The B2B buyer of 2026 doesn’t look, act, or research anything like the buyer of five years ago.
Here’s what the data says about how they actually behave.
How Do B2B Buyers Research Before Talking to Sales?
67% to 70% of the B2B buying journey happens digitally before a prospect ever speaks to a rep, per Worldwide Business Research.
88% of B2B buyers conduct online research before any purchase decision, and 60% start on Google, per Forrester.
90% of B2B buyers review 2 to 7 websites before making a purchasing decision.
81% of business decision-makers would rather get information from a well-researched article than a paid ad.
Source: Forrester B2B Buying Study, Worldwide Business Research
What Makes Buyers Ignore Your Outreach?
73% of B2B buyers actively avoid sellers who send irrelevant, generic messages, per Salesforce State of Sales 2026.
61% of B2B buyers would prefer a completely rep-free buying experience, per Gartner’s 2025 research. That doesn’t mean sales is dead. It means bad sales is dead.
The buyers who ignore you aren’t ignoring outbound as a channel. They’re ignoring outbound that isn’t relevant to them.
Sources: Salesforce State of Sales 2026, Gartner 2025 Sales Survey
What Makes Buyers Engage?
72% of buyers are more likely to engage with a rep who provides content tailored to their specific situation, per Demand Gen Report.
47% of buyers read 3 to 5 pieces of company content before speaking with a rep.
Personalized cold emails generate a 32% higher response rate than generic ones, per Salesloft.
82% of B2B buyers say creator content (thought leadership from individuals, not brands) influences their purchasing decisions, per LinkedIn’s 2025 B2Believe research.
Source: Demand Gen Report, LinkedIn B2Believe Report
What Do B2B Buyers Actually Want From Sales Outreach?
Three things, based on every buyer survey I’ve gone through in the last two years:
- Relevance: Reference something specific to my role, my company, or a real trigger event. Not “I saw you’re in SaaS.”
- Speed: If I reply, I want a response the same day. Not three days later.
- Value on every touch: Every follow-up should add something (a resource, a customer story, a new angle), not just ask if I’m ready to buy.
Real relevance starts with accurate data. Saleshandy’s Lead Finder gives reps 30+ people filters and 40+ company filters to segment prospects by role, industry, tech stack, funding stage, and hiring signals, so outbound isn’t blasted at generic titles.
Merge tags, Spintax, and AI Copilot personalize copy at scale without turning every email into a generic template. Unified Inbox surfaces replies fast so response time stays low.
Sales Referral and Social Selling Statistics
I think referrals and social selling are the two channels almost every outbound team underuses.
Yes, the ROI is well-documented, but the effort isn’t.
Here’s what the numbers actually show.
How Effective Are Referrals?
92% of consumers trust recommendations from people they know, higher than any other form of outreach (Nielsen).
Referred customers generate 16% more in profits over their lifetime than non-referred customers (Wharton School of Business).
In B2B specifically, 65% of a company’s new business typically comes through referrals.
Yet only 30% of companies have a formal referral program in place. The math strongly favors doing this, and most teams still don’t.
Sources: Nielsen Global Trust in Advertising, Wharton School of Business, ThinkImpact
Does Social Selling Work?
Sales professionals who use social selling consistently are 51% more likely to hit quota, per LinkedIn Sales Solutions.
78% of salespeople who use social media outsell peers who don’t. Companies acquire 80.3% of their B2B buyers from LinkedIn, compared to 12.7% from Twitter/X and 6.7% from Facebook.
For B2B outbound in 2026, LinkedIn is where the warm-up happens. Cold email and calls stay the conversion engines.
Source: LinkedIn Sales Solutions Research
Sales Closing Statistics
Closing doesn’t happen in a moment, right?
It’s the sum of every conversation, follow-up, and small commitment that came before it.
Here’s what separates the reps who close from the reps who chase.
Why Do Most Reps Fail to Close?
Surprisingly, a large share of sales calls end with no clear next step, proposed timeline, calendar link, or commitment.
Only 24.3% of salespeople exceeded quota, per Sales Insights Lab. That number has stayed roughly flat since.
The gap between top closers and average reps isn’t usually product knowledge. It’s closing cadence. Top closers ask for the next step on every single call.
Source: Sales Insights Lab
What Do Top Closers Do Differently?
Gong’s data on winning conversations shows top closers:
- Ask more discovery questions than average reps (2 to 3x more on average)
- Talk for roughly 54% of the call, letting the prospect fill the rest
- Use collaborative language (“we,” “us,” “our”) 10x more often than losing calls
- Follow a consultative approach, which delivers 25% higher close rates than product-led pitching
Optimism also matters more than most people admit.
Optimistic sales professionals outperform pessimists by 57%, even when the pessimistic reps have stronger product knowledge (HubSpot).
Sources: Gong.io Winning Conversations Research, HubSpot
Cold Calling vs Cold Email vs Social Selling: How Do They Compare?
Here’s how the three main outbound channels stack up in 2026:
| Metric | Cold Email | Cold Calling | Social Selling |
|---|---|---|---|
| Average response/connect rate | 0.60% reply rate (Saleshandy data) | 44.63% connect rate (Saleshandy data) | 15–25% acceptance / low reply |
| Buyer preference | 80% prefer email for first contact | 57% of C-suite prefer phone | 82% engaged by creator content |
| Persistence required | 5–7 touches per sequence | 8+ dials per prospect | Multi-week engagement + posting |
| ROI | $36 per $1 spent (HubSpot) | $215–$400 cost per outside sales call | Long-term brand + pipeline lift |
| Best for | Scale, top-of-funnel, mid-market | High-value / decision-maker outreach | Warming, credibility, ABM |
| Saleshandy capability | Automated sequences, A-Z testing, Unified Inbox, deliverability suite | Built-in dialer, local presence, AI summaries, voicemail drop | LinkedIn automation steps inside sequences |
Key takeaway: No single channel wins alone in 2026. Every metric I’ve looked at (SPOTIO’s field data, Salesforce’s State of Sales, and Saleshandy’s own dialer data showing 100% of dialer users also run email + LinkedIn) points to the same conclusion.
Multichannel wins, single-channel loses.
How Saleshandy Helps You Turn These Sales Statistics Into Desired Results
Every stat in this blog points to the same reality: outbound in 2026 rewards teams who move fast, personalize at scale, and never let a follow-up slip.
And that’s exactly what Saleshandy is built for. 🤩🤩
Picture your day without switching between eight tools.
Lead Finder pulls verified contacts from 852M+ prospects with 98% accuracy.
Automated multichannel sequences run email, calls, LinkedIn, and WhatsApp on autopilot.
The built-in Dialer handles local presence and AI call summaries.
Unified Inbox catches every reply.
Deliverability stays healthy in the background with warm-up, sender rotation, and inbox placement testing.
And the best part most of our clients love is no per-seat pricing, no separate warm-up tool, or no extra dialer bill.
Just a single, simpler workflow, built to close the gap between what these statistics show and what your pipeline actually looks like. So what are you waiting for?
Start your 7-day free trial of Saleshandy →
FAQs People Ask Me About Sales Statistics
1. What percentage of sales reps hit their quota in 2026?
Only about 16% of sales reps hit quota in the past year, meaning 84% missed it, per Salesforce State of Sales 2026. That’s the widest quota-attainment gap on record. The main reasons: quotas rose 37% while markets grew less than 10%, sales cycles are 23% slower than two years ago, and reps are drowning in 10+ disconnected tools instead of selling.
2. How many follow-ups does it take to close a sale?
80% of successful sales require 5 or more follow-ups, per ZoomInfo. The full range lands between 5 and 12 touches depending on deal complexity. Yet 44% of reps stop after one attempt, and 92% quit before the fifth. Plan for 8 to 12 multichannel touchpoints (email, phone, LinkedIn) across a 14 to 21-day window before deprioritizing a prospect.
3. Is cold calling still effective in 2026?
Yes, but the numbers demand persistence. 69% of B2B buyers accepted a cold call from a new provider in the past year, and 57% of C-suite executives prefer phone outreach. But only 2% to 3% of cold calls end in a booked meeting, and 80% go to voicemail. The teams winning at cold calling in 2026 use dialers with local presence, AI summaries, and multichannel cadences wrapped around each dial.
4. What is the average cold email response rate?
Across 74.3M cold emails sent through Saleshandy, the average reply rate is 0.60%, with a positive reply rate (interested prospects) of 0.10%. Open rate averages 11.75%. Backlinko’s broader email outreach study cites an 8.5% response rate for outreach in general, but true cold sales outreach typically sits in the sub-1% range at scale.
5. How much time do sales reps spend actually selling?
Just 40% of a rep’s time goes to actual selling, per Salesforce State of Sales 2026. The other 60% goes to admin, data entry, internal meetings, and hunting for content. Gartner puts the non-selling number even higher at 50%+. Ken Krogue’s Forbes analysis pegs true revenue-generating selling time at just 28% to 35% of a rep’s week.
6. What is the average sales close rate?
The average opportunity-to-closed-won rate across industries sits at roughly 20%, per HubSpot. Software averages 22%, biotech closer to 15%. Whole-funnel conversion (visitor-to-customer) is much lower, typically 2% to 5%. Teams with formal sales enablement programs hit 49% on forecasted deals, nearly double the industry norm.
7. Which outreach channel has the highest ROI?
Cold email has the highest measurable ROI per dollar spent ($36 for every $1, per HubSpot). But no single channel wins alone in 2026. Combining email, phone, and LinkedIn drives 287% higher response rates than email-only outreach, per SkipCall. And 100% of Saleshandy dialer users also run email and LinkedIn sequences — multichannel is the standard.
8. How is AI being used in sales in 2026?
94% of sales leaders with AI agents say they’re essential to hitting business goals. Reps who partner with AI are 3.7x more likely to hit quota, per Gartner. 86% of AI-using teams report positive ROI within their first year. Top use cases: prospect list generation, sequence copywriting, reply categorization, and call summaries. AI isn’t replacing reps. It’s handling the admin so reps can spend more time on the parts of selling that require a human.

 Dhruv Patel
![14 Sales Pitch Examples I Use in 2026 [Definition + Tips]](https://www.saleshandy.com/blog/wp-content/uploads/2026/01/Best-Sales-Pitch-Examples-Steal-These-to-Close-Deals.webp)